Entrust PKI Hub provides a Grafana web portal for browsing logs and metrics.
To browse Timestamping Authority logs with Grafana
- Log into Grafana as explained in Browsing logs with Grafana.
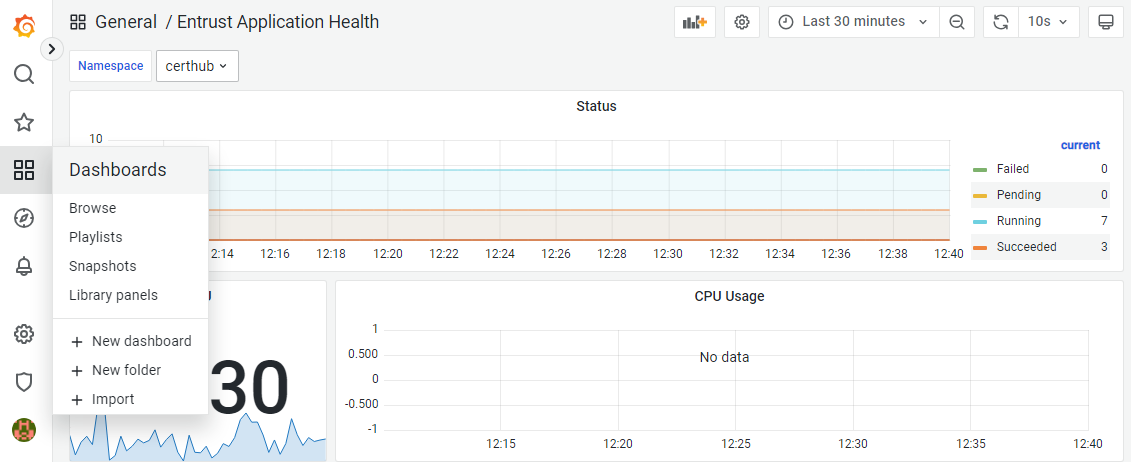
- In the left sidebar of the Grafana portal, click the four squares icon and select Dashboards.
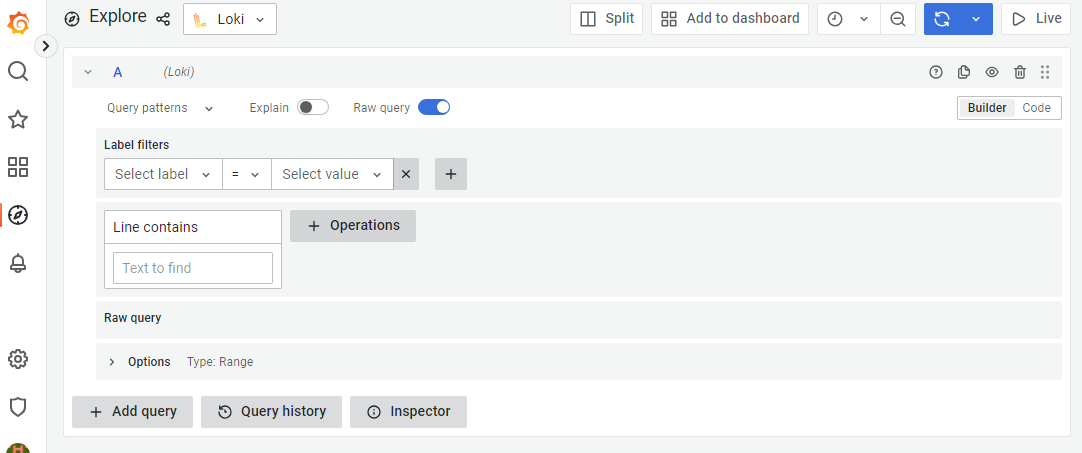
- Select Loki in the top menu.
- Select a time frame in the top menu.
- Add the following log filters described in the below sections.
- Click Run query.
Auditing the executed tsactl commands
Add the following filters under Label filters to audit the execution of the tsactl command line tool.
Select label | Select value | Query output |
|---|---|---|
filename | /var/log/entrust/tsa/tsactl.log | A record of all the executed |
Checking the clock status
Add the following filters under Label filters to query clock status service logs.
Select label | Select value | Query output |
|---|---|---|
namespace | tsa | Timestamping Authority logs. |
app | clockstatus | Logs of the clock status service. |
Use the Line contains field to filter time checking logs.
Line contains | Query output |
|---|---|
"GetClockData. | Logs for time checking operations. |
Querying timestamping request logs
Add the following filters under Label filters to query timestamping request logs.
Select label | Select value | Query output |
|---|---|---|
namespace | tsa | Timestamping Authority logs. |
app | tsa | Logs of the timestamping service. |
Use the Line contains fields to add filters like the following.
Line contains | Query output |
|---|---|
"ProcessTimeStampRequest. | Logs for all timestamping requests. |
"ProcessTimeStampRequest.Failed" | Logs for failed timestamping requests. |
"endpoint":"<issuerID>" | Logs for timestamping requests received by the |

