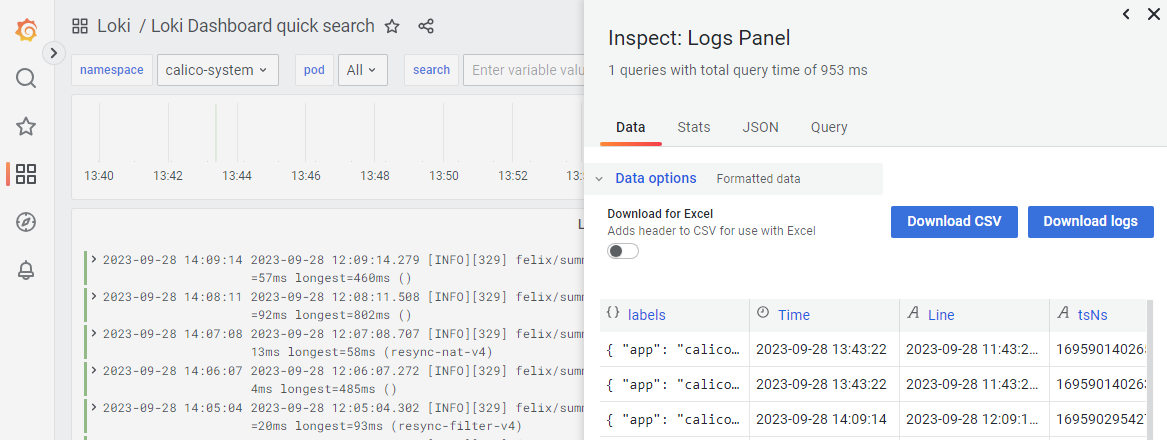
The Grafana Loki Dashboard allows browsing and exporting the logs of the following namespaces.
Namespace | Monitored service |
|---|---|
<solution> | The deployed Entrust solution with the |
calico-system | The Calico networking service. |
csf-docker-registry | The Docker registry. |
longhorn-system | The Longhorn system. |
istio-system | The Istio system. |
csf-monitoring | The Prometheus service. |
csf-logs | The Loki service. |
kube-system | The K3s system. |
management-console | The web console for deploying and managing Entrust solutions. |
tigera-operator | The Tigera Operator. |
auth-service | The authentication system for Entrust PKI Hub administrators. |
solution-manager | The service for managing the deployed Entrust solutions. |
To browse and export logs with the Grafana Loki Dashboard
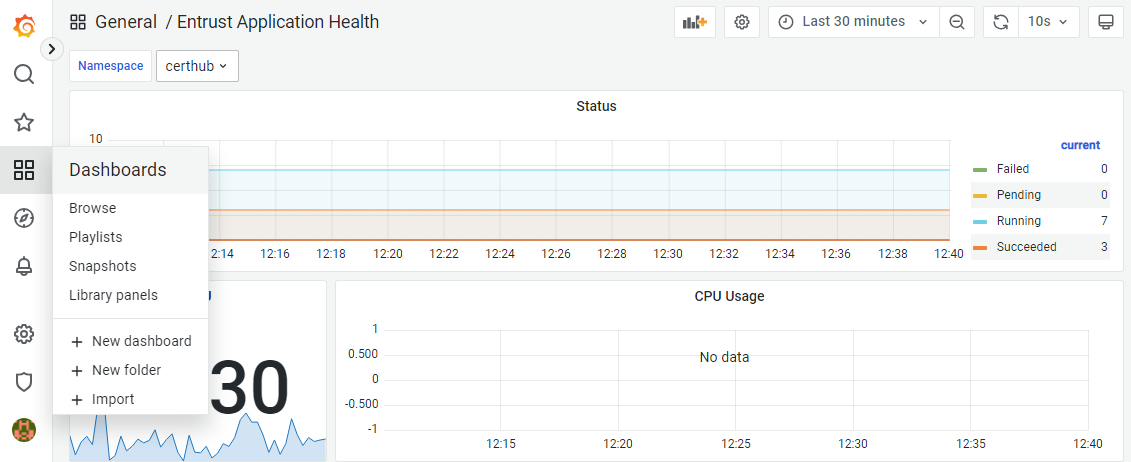
- In the left sidebar of the Grafana portal, click the four squares icon and select Dashboards.
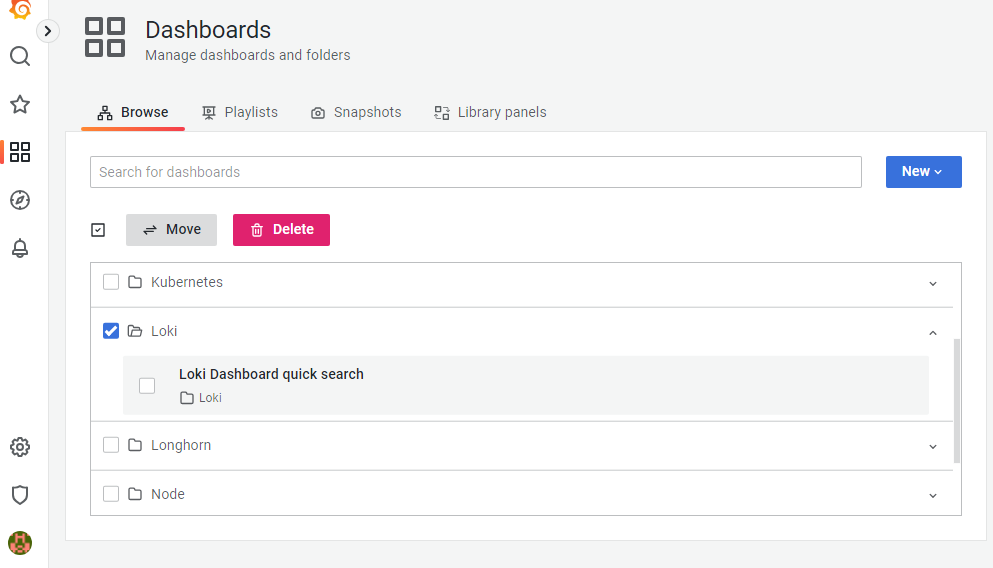
- In the Dashboards page, select Loki > Loki Dashboard quick search.
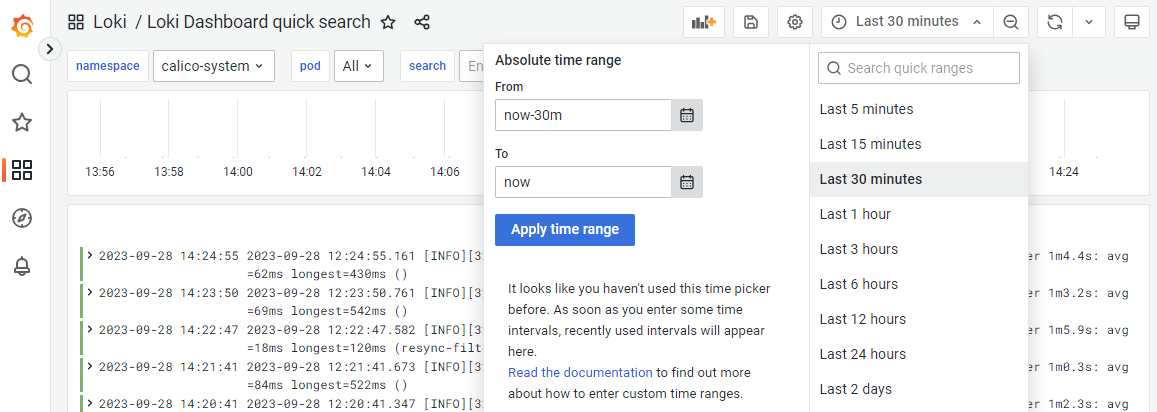
- In the Locki Dashboard quick search page, use the namespace, pod, search, and time range menus to filter logs.
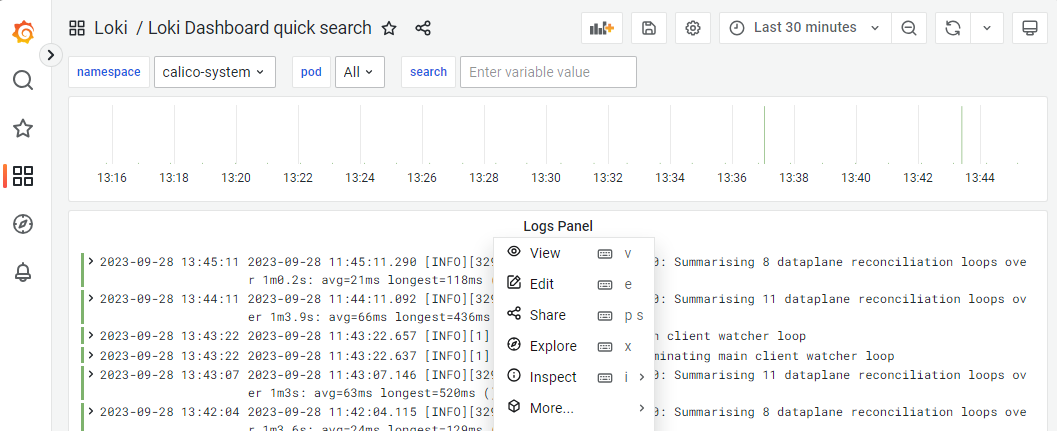
- In the Logs Panel drop-down list, select Inspect.
- In the Inspect: Logs Panel sidebar, select the Data tab.
- In the Data tab, click:
- Download CSV to download the logs into a CSV file.
- Data options > Download for Excel and Download CSV to download the logs into an Excel-compatible CSV file.
- Download logs to download the raw logs into a text file.
